Price Action Algo Trading (PAAT) Daily Trade Journal
Examples of PAAT System Daily Trades
These examples showcase daily trades executed by our graduate students and instructors using the PAAT system. They are provided solely for educational purposes to help you grasp how the PAAT System operates in live markets. Before proceeding to the sections below, we kindly request that you read the disclaimer footnote and access the link to the Limitation of Liabilities.
We have created this section dedicated to PAAT Journals to demonstrate its effectiveness across various markets. However, before you delve into the trading day journal videos, let’s take a moment to provide a brief overview of what PAAT entails and how it operates.
How the Price Action Algo Trading System Works?
PAAT, which stands for Price Action Algo Trading, is a highly successful trend-following trading system. It utilizes three different timeframes: Macro (highest timeframe), Structure (middle timeframe), and Trading (smaller timeframe) charts. Each timeframe differs by a factor of 3-10, enabling traders to observe smaller price swing waves within larger ones.
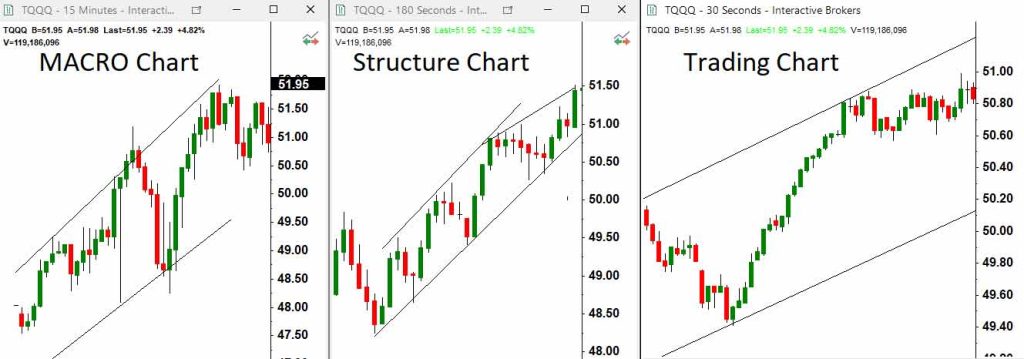
By incorporating these three charts, the PAAT system offers a total of 27 possibilities based on different combinations of chart patterns. However, it is important to note that only 6 of these possibilities are considered tradable based on our main Trend-following Setup-T, while the remaining 21 should be filtered out due to their higher risks:
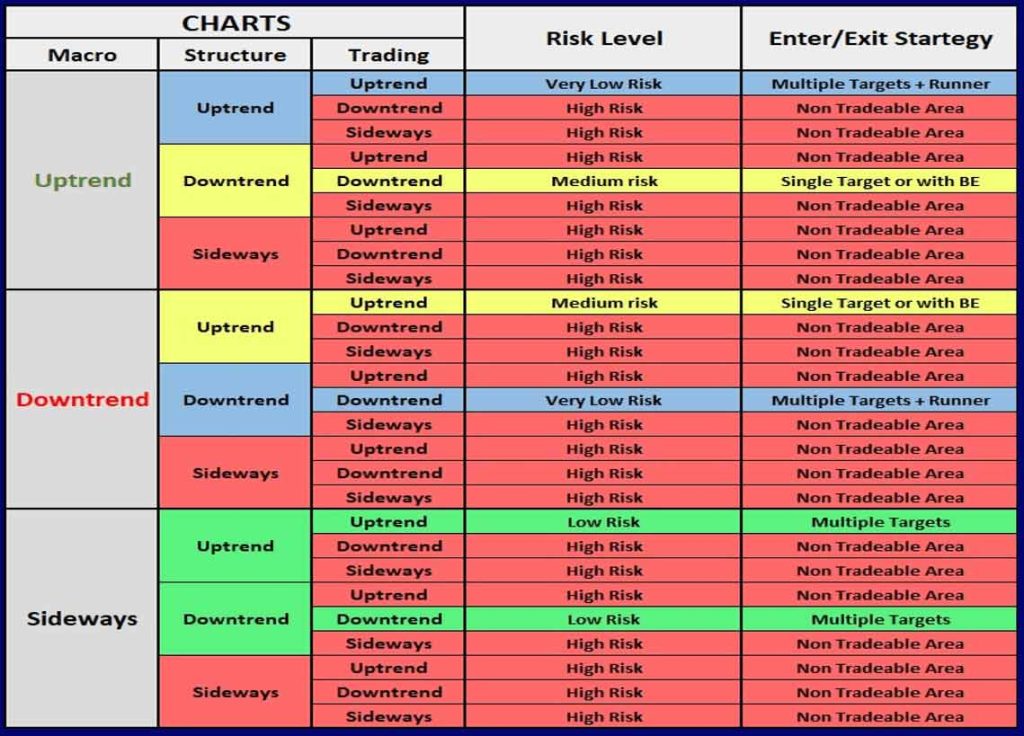
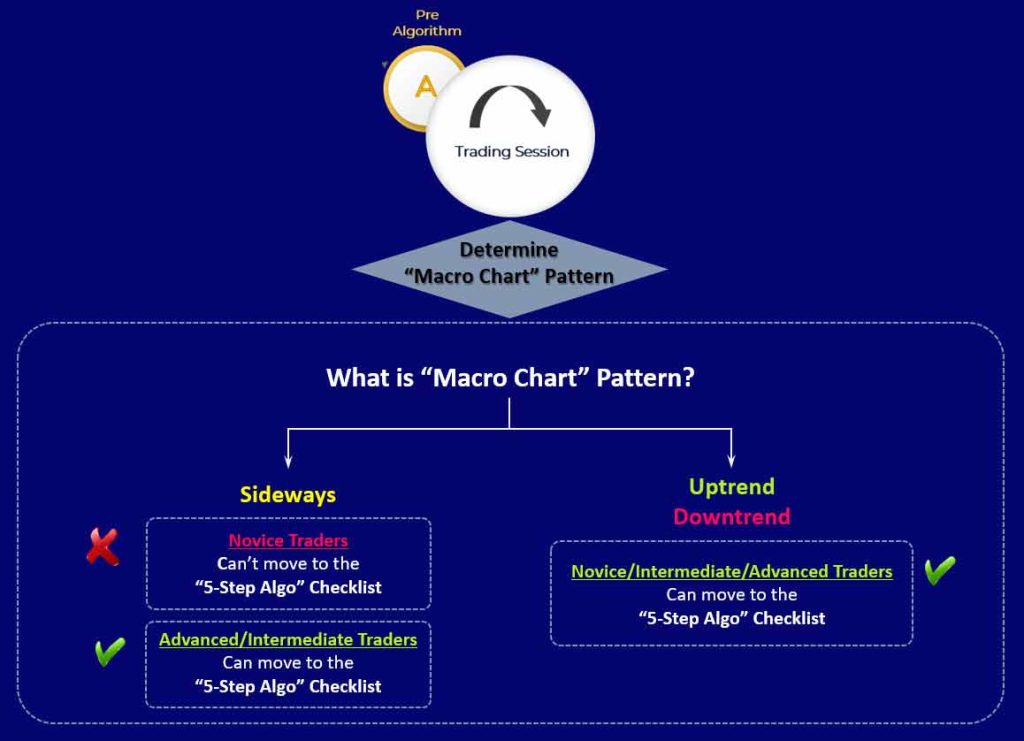
The Macro chart plays a crucial role in assessing trading risks. It is evaluated through a pre-algorithm check section within the trading plan to determine the suitability of entry risks based on the trader’s experience. This step ensures that the trading decisions align with the trader’s risk tolerance and expertise.
The Structure Chart is employed to identify the trend within the middle timeframe and assess its momentum (Algo 2). It allows traders to analyze price movements and determine the strength and direction of the trend and is part of Algo 3 to determine the high-probability trading area.
The Trading Chart is utilized to identify pullbacks in line with the overall structural trend and locate the High Probability Trading Areas (Algo 3). Traders can pinpoint entry points within these areas that offer a favorable risk-to-reward ratio (R/R)(Algo 4 and 5). This approach enhances the likelihood of successful trades and their win rates by strategically selecting entry areas with optimal profit potential relative to the associated risk.
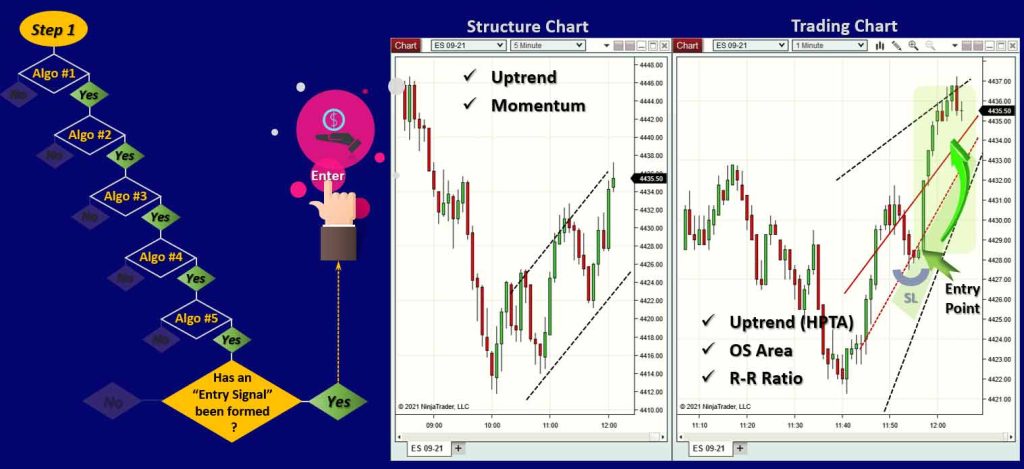
This is accomplished through the implementation of five conditional algorithms, complemented by an entry signal confirmation. Here is a brief explanation of each algorithm:
Algo 1 – Analysis of Trends: Verifies that the pattern observed on the Structure Chart exhibits a trending behavior.
Algo 2 – Analysis of Momentum: Ensures that the identified trend on the Structure Chart remains strong and has not weakened, indicating the potential end of the trend.
Algo 3 – Analysis of High Probability Trading Area (HPTA): Validates that the pattern observed on the Trading Chart demonstrates a trending behavior, and its direction aligns with that of the Structure Chart, whether it is an uptrend or a downtrend.
Algo 4 – Analysis of OB/OS: Confirms whether the price on the Trading Chart has reached an oversold area in an uptrend or an overbought area in a downtrend. This analysis helps assess potential reversal points in the market.
Algo 5 – Analysis of R/R: Verifies that the price on the Trading Chart offers a suitable initial Risk-to-Reward Ratio at the entry point. This analysis evaluates the potential profit relative to the associated risk, ensuring a favorable risk-reward balance.
By applying these five algorithms and confirming the entry signal, the PAAT system enhances the accuracy of trade decisions and helps traders identify high-probability setups with favorable risk-reward characteristics.
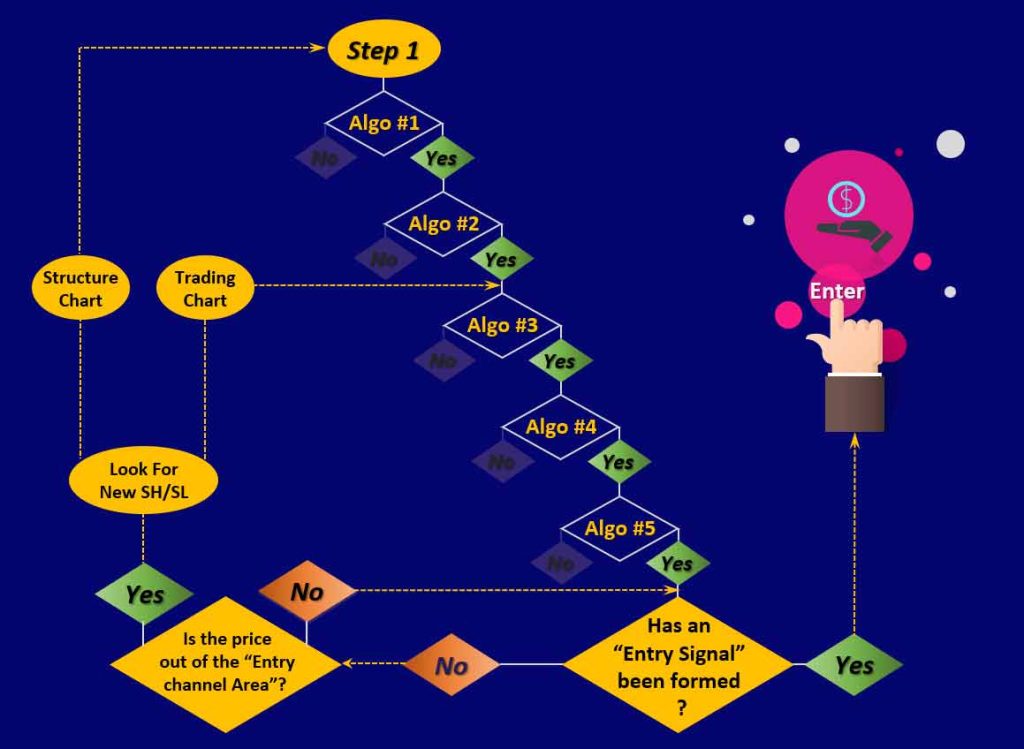
This is the core of our high win rate price action trading system, which functions like a powerful engine for modern trading. This engine is integrated into a robust Trading Plan that encompasses all the safety features of modern vehicles, ensuring that traders adhere to crucial elements of psychology and risk management before and during their trading sessions.
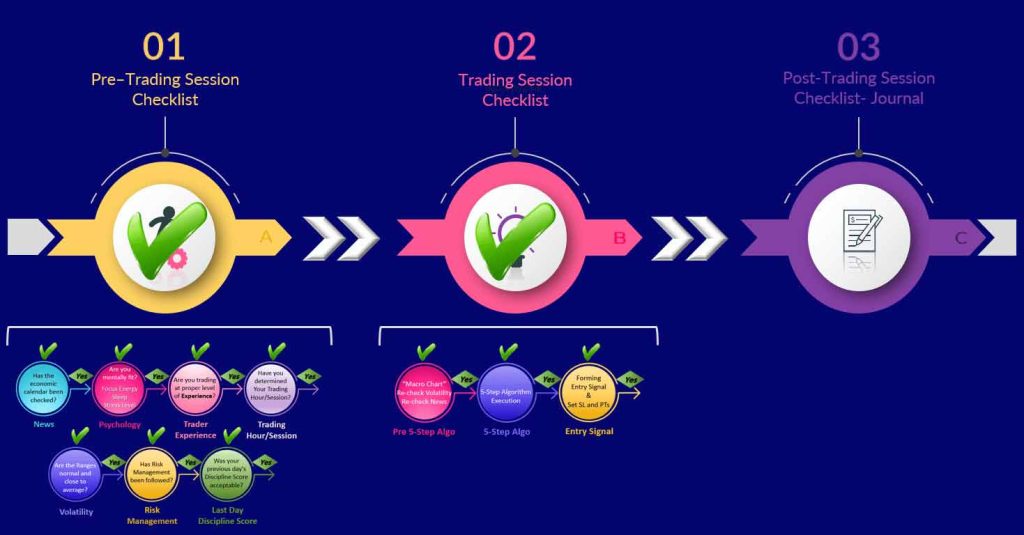
The Trading Plan is presented as a smart Excel checklist that cultivates proper safety habits and includes a crucial Post-Trading Session Journal. This journal holds significance in personalizing trading approaches from the outset and facilitating performance improvement in collaboration with a trader’s coach. We will examine a selection of live trades executed by the PAAT system, documented through the use of the intelligent trading plan Excel file.
