Trend Channel Breakout
In this lesson of Module 3, Workshop 8, we will discuss the concept of Trend Channel Breakout.
You will learn how to recognize the Trend pattern breakout and interpret its conversion to another Trend or sideways patterns.
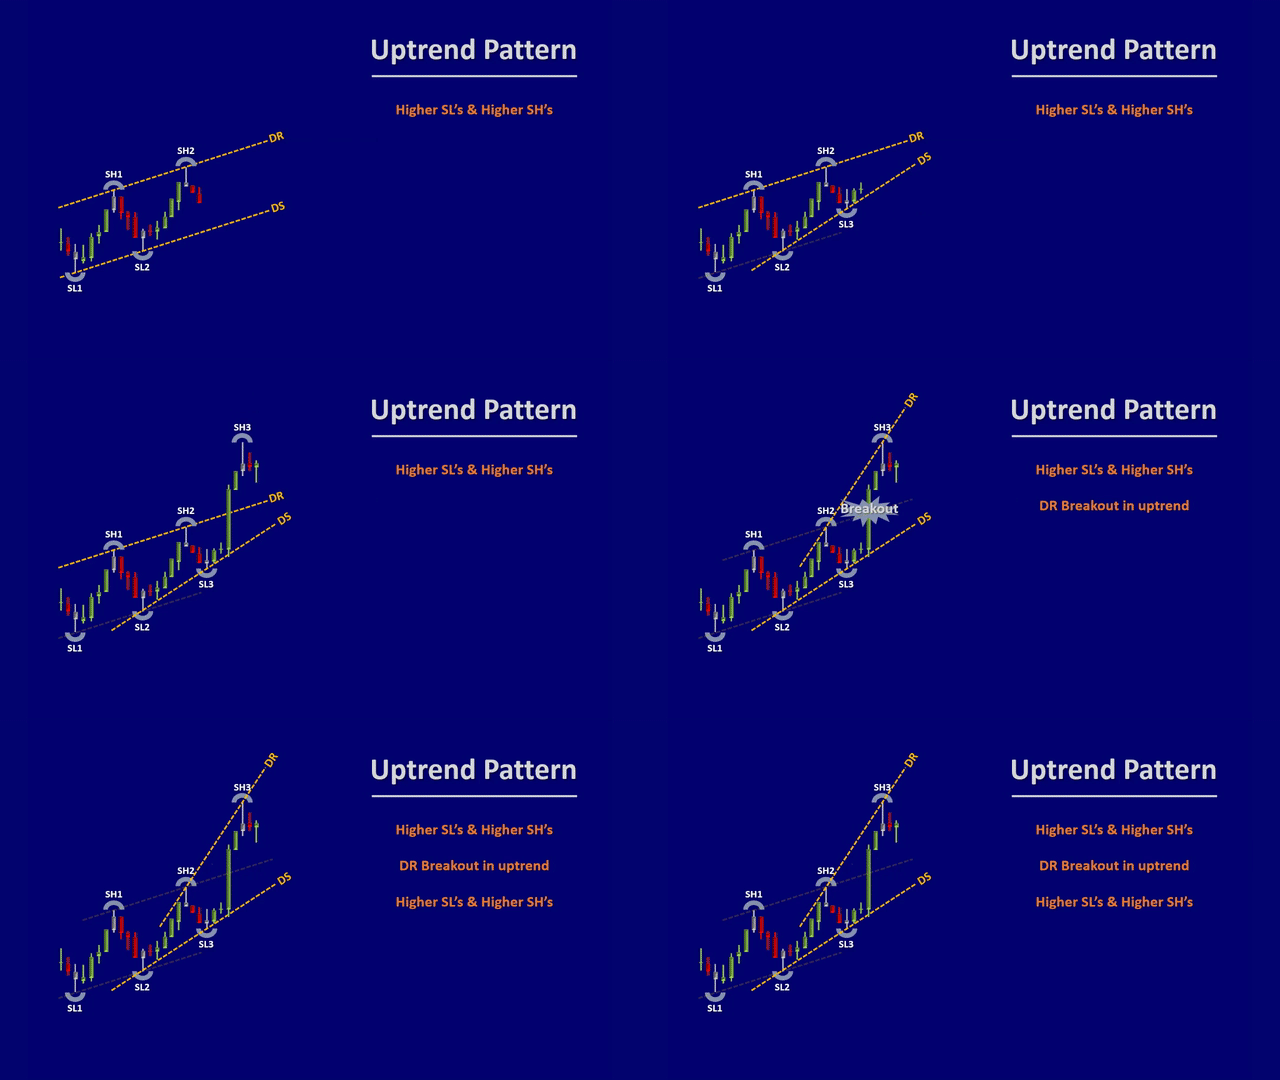
As you update the dynamic channel in an uptrend pattern and see the price breaks the dynamic resistant line, you often see that the new pattern has higher Swing highs and higher swing lows, Which indicates the continuation of the uptrend pattern.
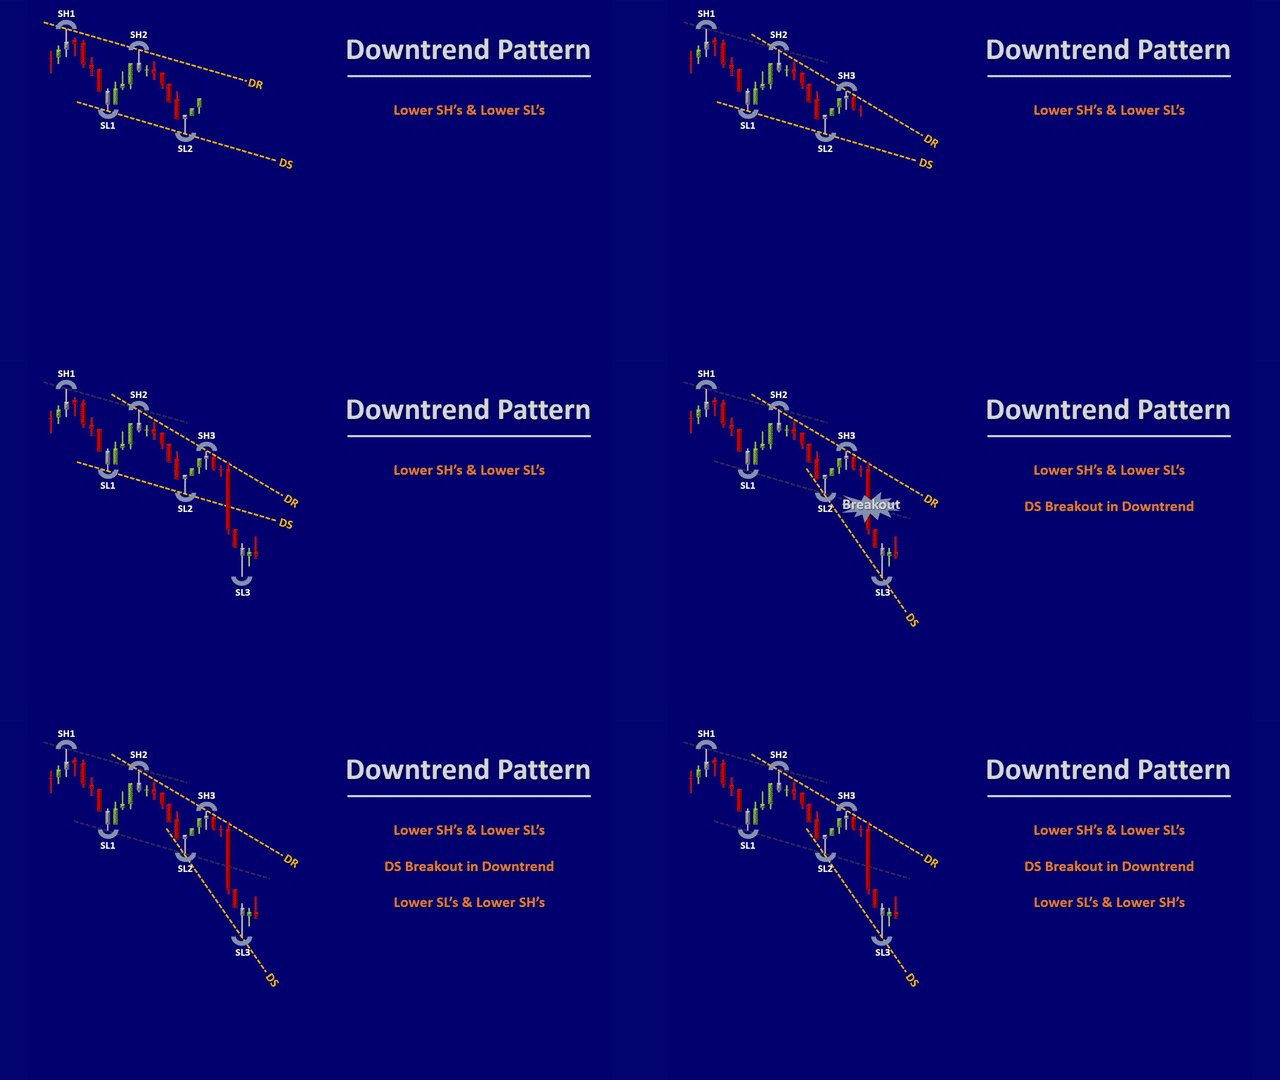
When you update the dynamic channel in a downtrend pattern and see the price breaks the dynamic support line, you often see that the new pattern has lower Swing Lows and lower Swing Highs, Which indicates the continuation of the downtrend pattern.
You will learn how to recognize the Trend pattern breakout and interpret its conversion to another Sideways pattern.
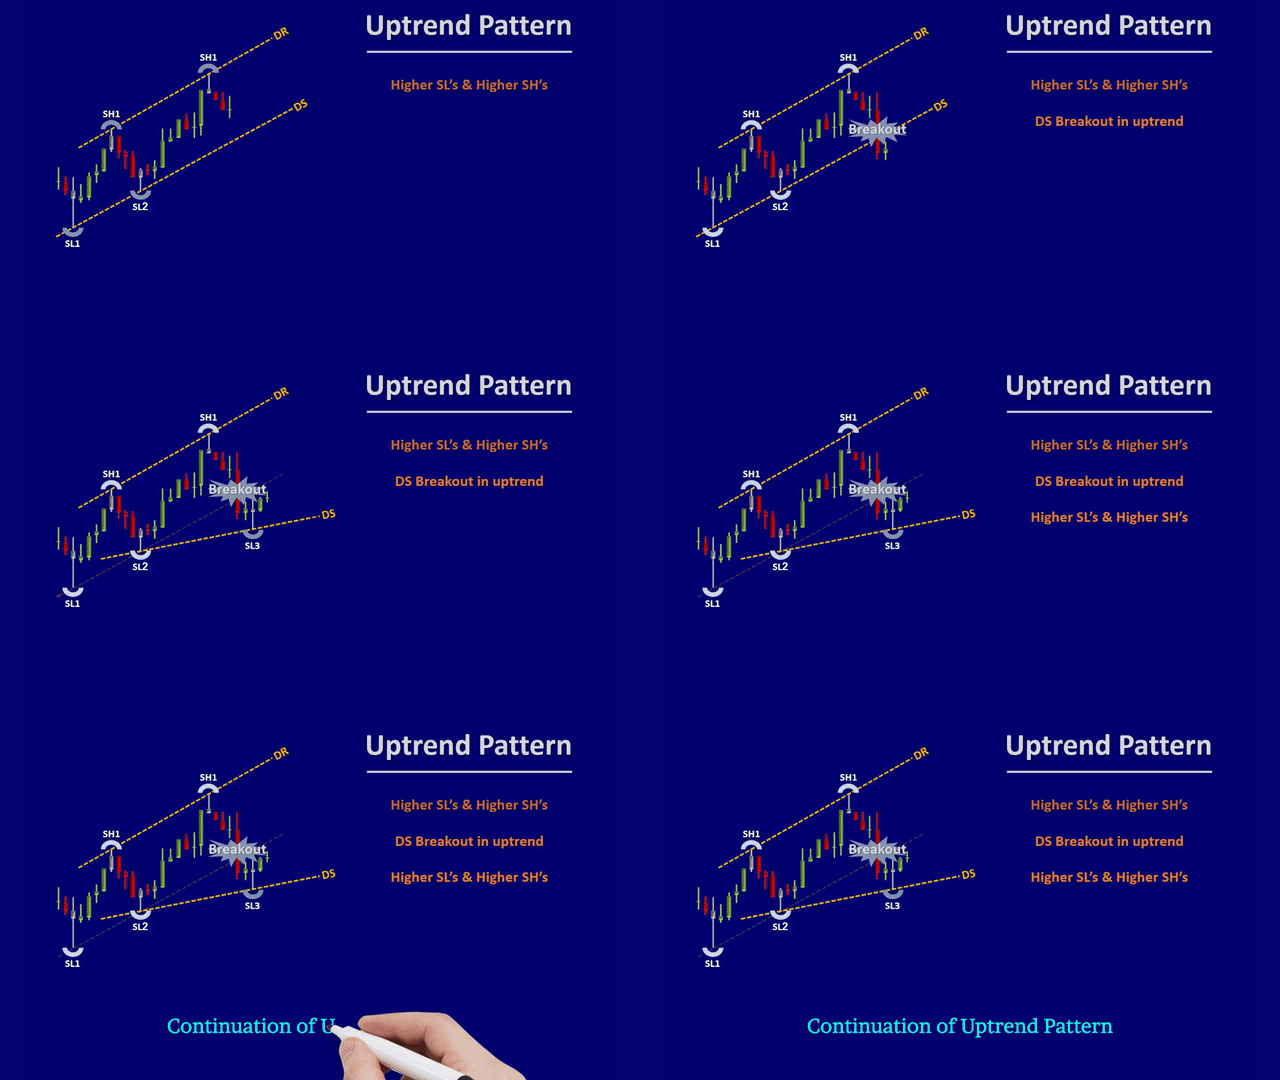
As you update the dynamic channel in an uptrend pattern and see the price breaks the dynamic support line, you may see that the new pattern has higher Swing highs and higher swing lows, Which indicates the continuation of the uptrend pattern.
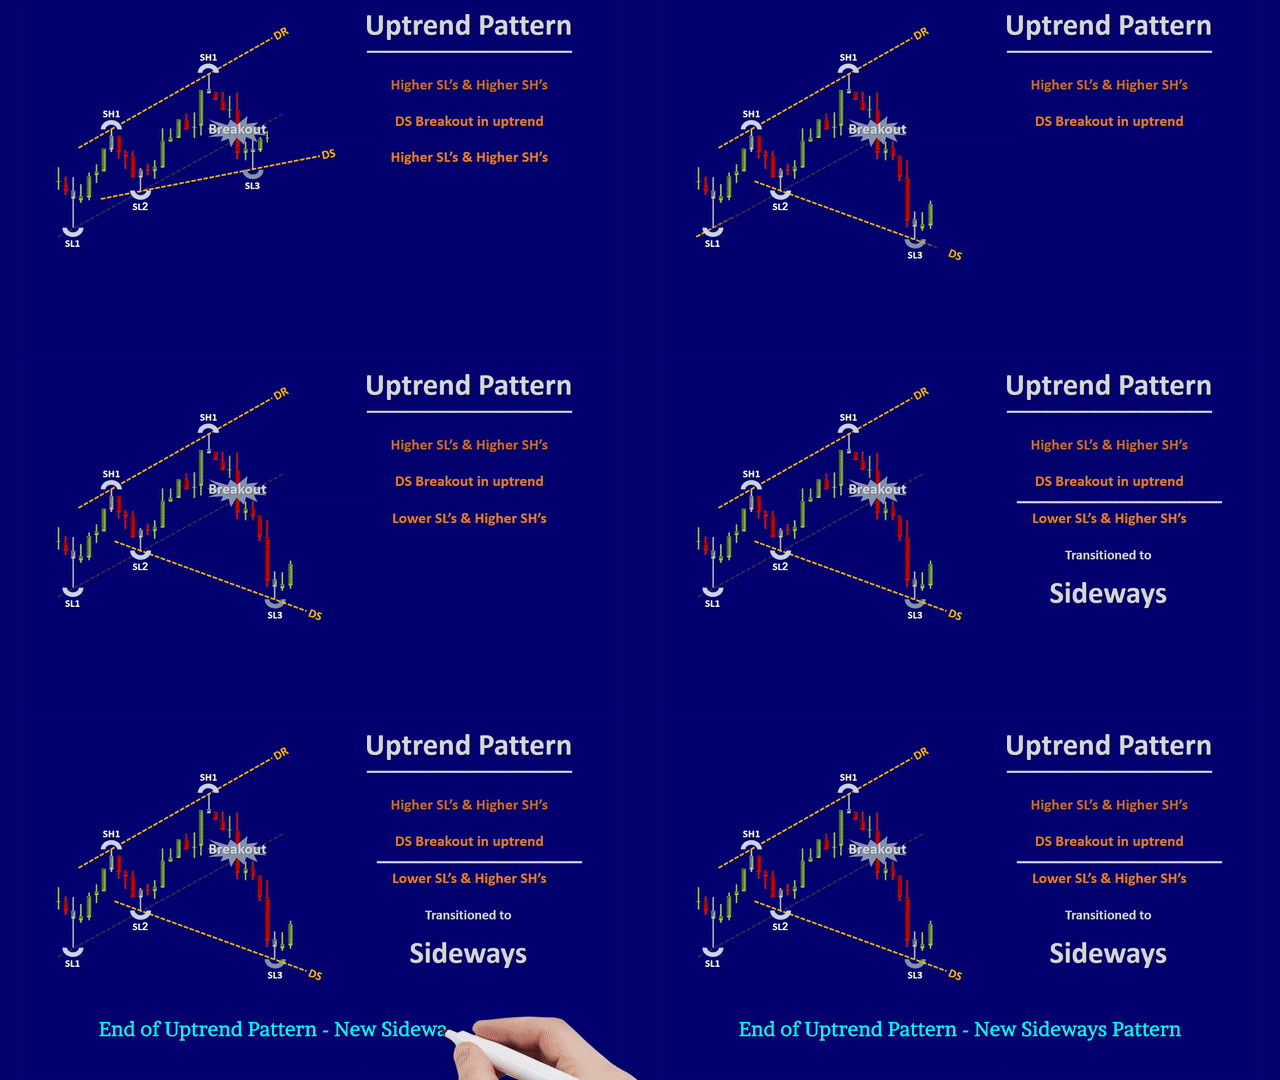
Or you may see that the new pattern has higher Swing highs but lower swing lows, Or other variations of Sideways patterns, This indicates the uptrend has ended and the market entered a sideways pattern.
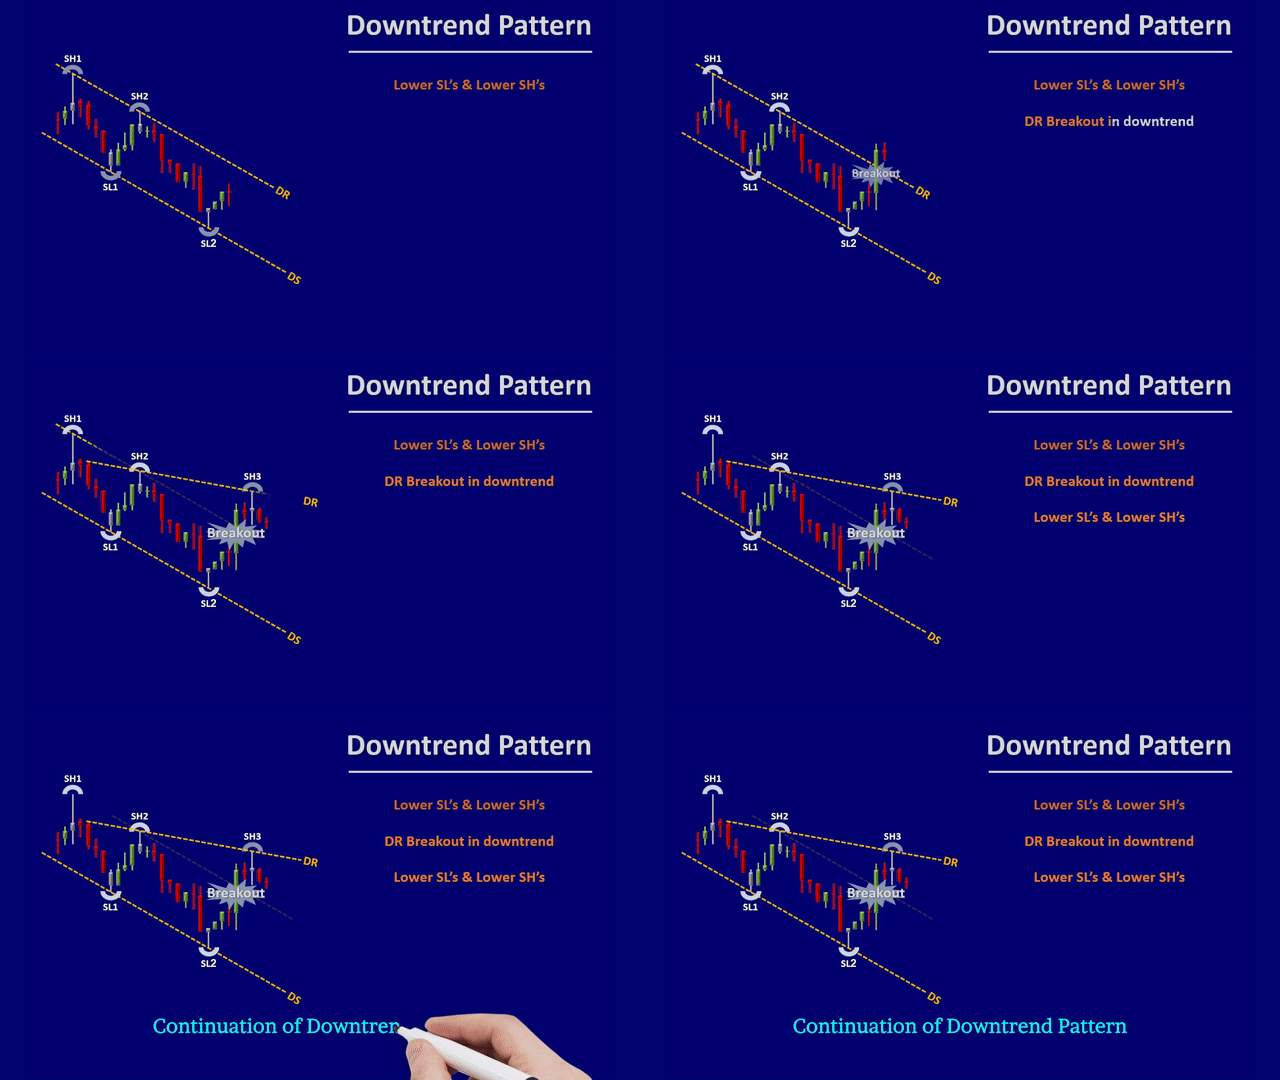
When you update the dynamic channel in a downtrend pattern and see the price breaks the dynamic resistance line, you may see that the new pattern has Lower Swing Lows and Lower swing highs, Which indicates the continuation of the downtrend pattern.
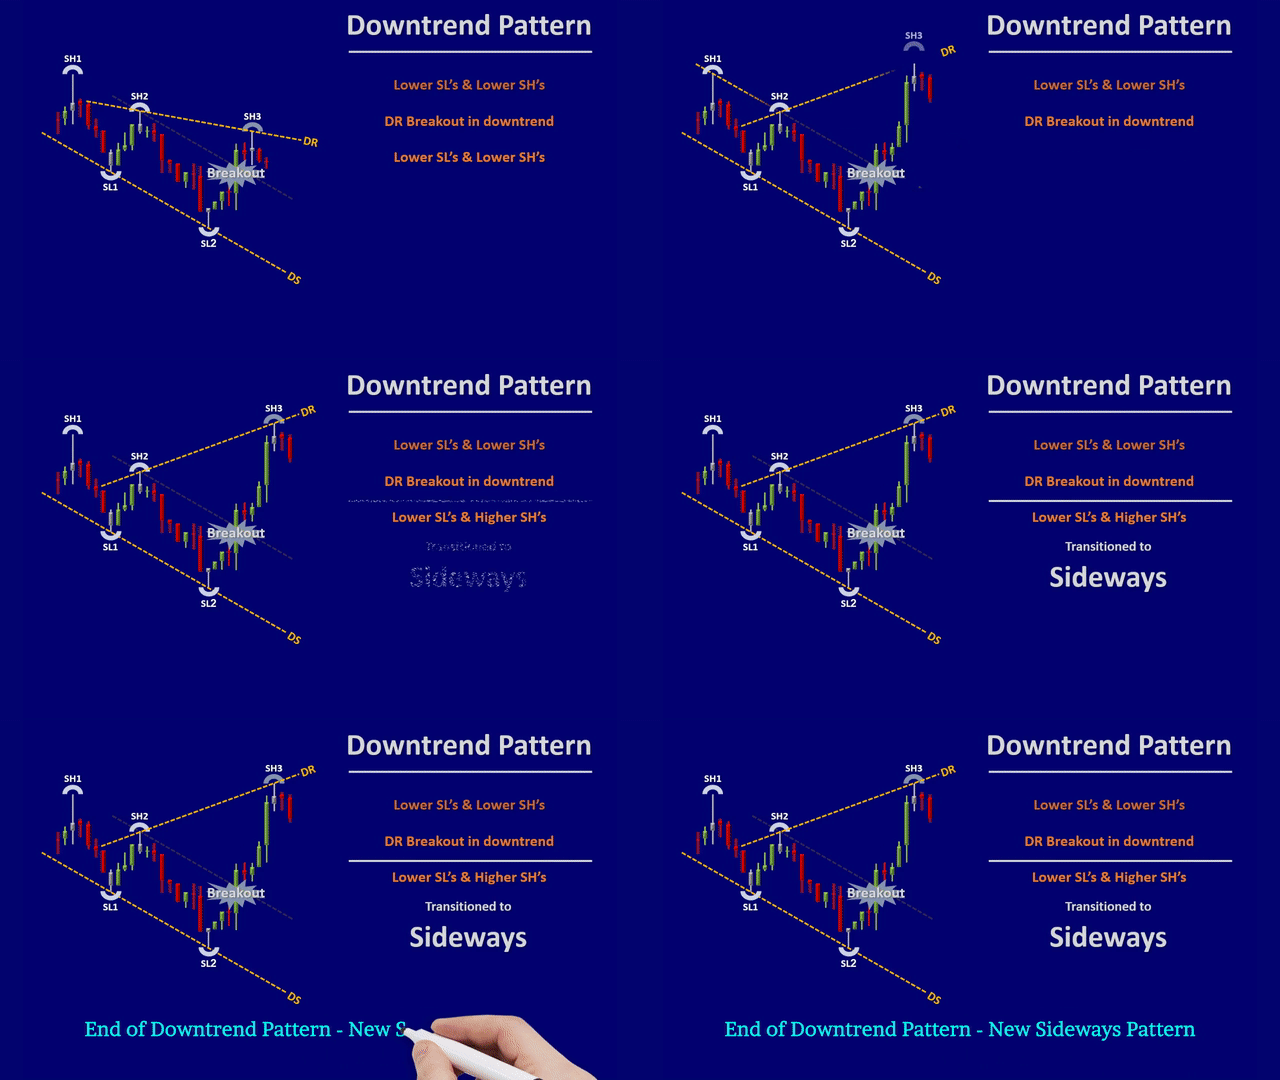
Or you may see that the new pattern has lower Swing Lows but Higher swing Highs, Or other variations of Sideways patterns, This indicates the downtrend is ended and the market entered a sideways pattern.

