In this lesson of chapter 9, we will review what you have learned in the past few chapters and practice the process of recognizing the interconversion of sideways and trend patterns in a forward-testing manner that resembles the dynamics of a live market chart.
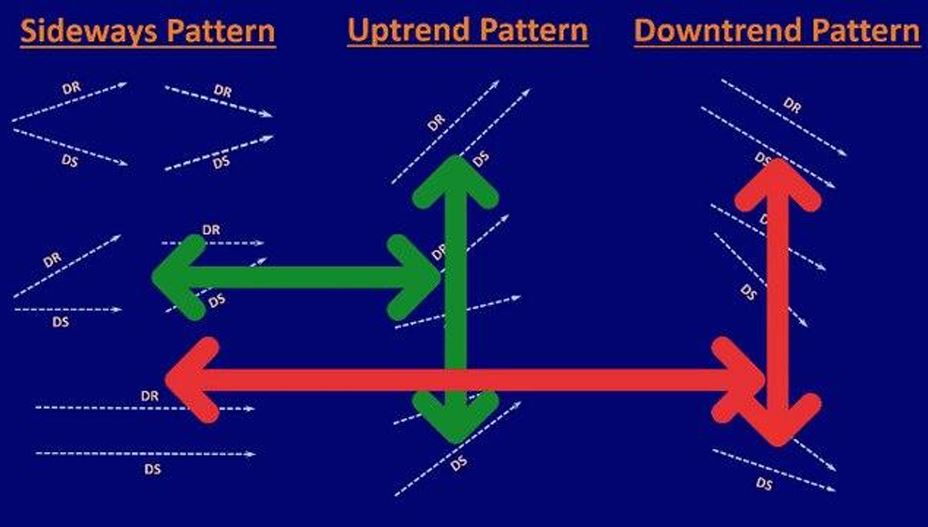
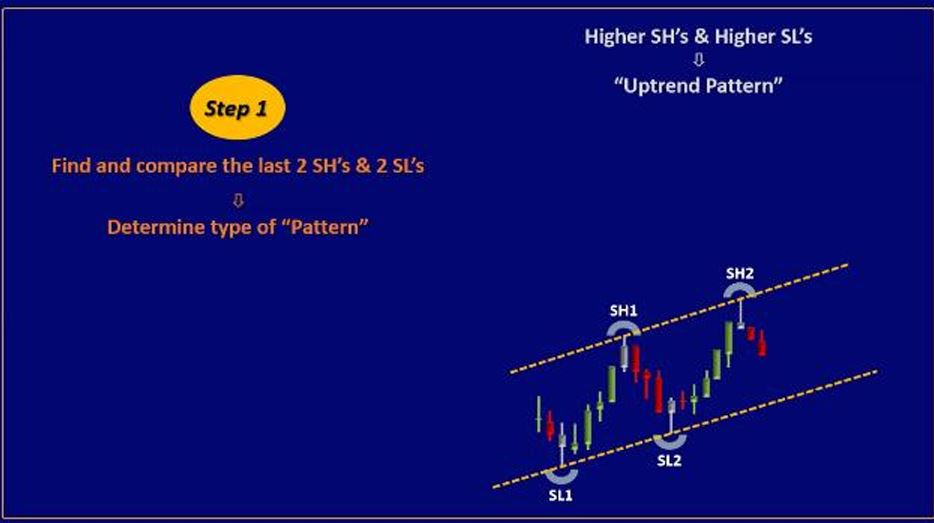
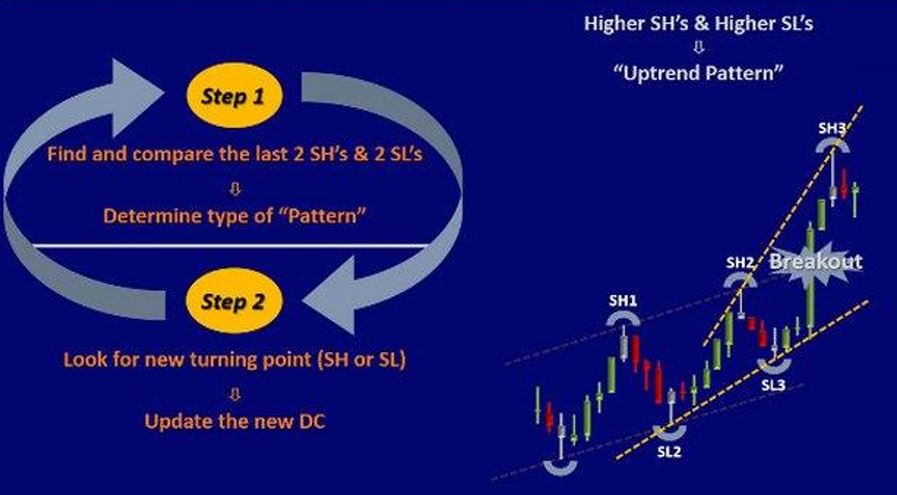
To efficiently recognize the interconversion of price chart patterns in an objective manner, you can follow this simple 2-step process: 1. Step 1: Analyze the DS and DR lines of the updated Dynamic Channel based on the last two swing highs and two swing lows to determine the current market pattern: For example, in the current market example provided below, we can observe that the dynamic channel displays a higher swing high and higher swing low, indicating an uptrend pattern:
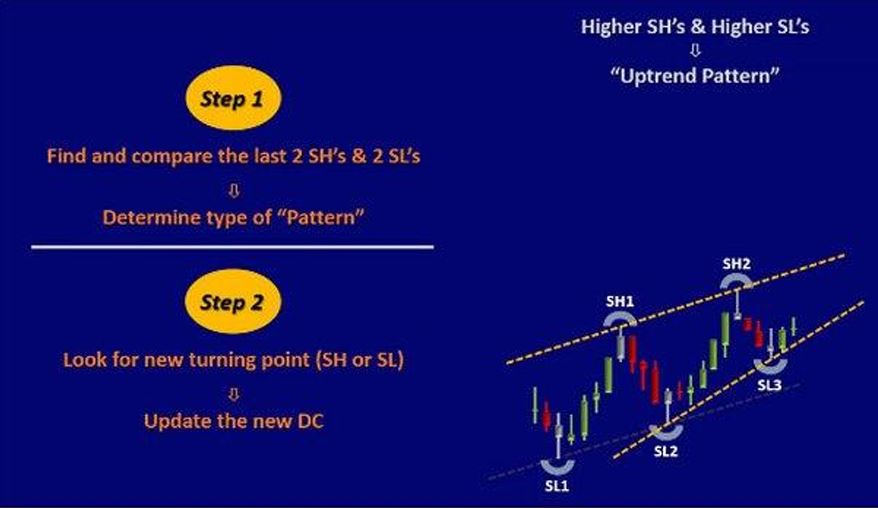
2. Step 2: Look for the formation of a new SH or SL and update the dynamic channel accordingly. In the same example, as we follow the market development in real-time, we observe the formation of a new swing low. Therefore, we update the dynamic channel accordingly, as illustrated below:
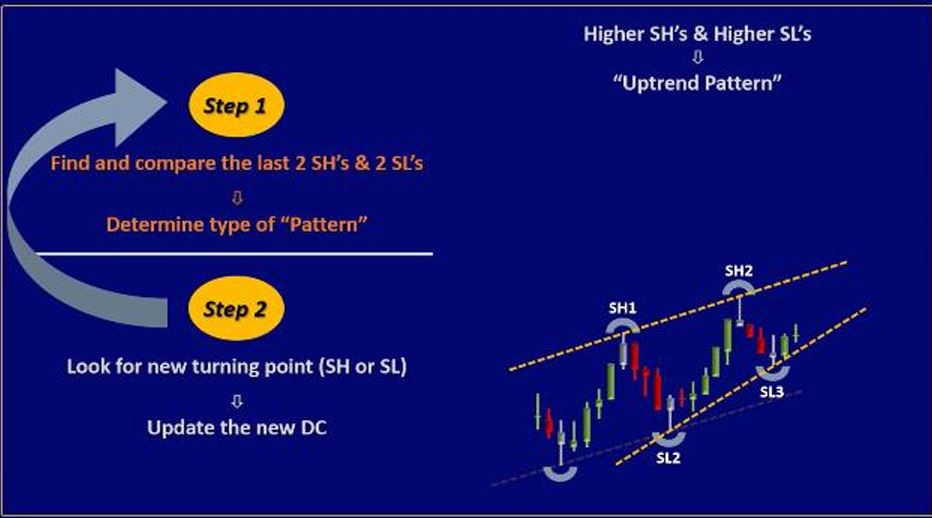
Then, we simply repeat this 2-step process to continuously analyze new patterns and update the dynamic channel with every new SH or SL. In the example above, we need to go back to step 1 and analyze the type of the new pattern. Upon analysis, we can still observe that the dynamic channel reflects an uptrend pattern that has continued, as illustrated below:
By following the market development in the example above, we proceed to Step 2 of the process and look for a new SH and update the new Dynamic Channel accordingly. Upon analyzing the chart, we observe that the price has broken the previous dynamic support line, and a new SH has been formed above that line, as illustrated below:
Then, based on Step 1, we analyze the type of the new pattern and notice that the dynamic channel continues to display an uptrend pattern that is getting stronger, as illustrated below: If we follow the market development on the above price chart example, we proceed to step 2 and look for a new price turning point and update the new dynamic channel. By analyzing the type of the new pattern based on step 1, we observe that the dynamic channel shows the continuation of an uptrend pattern, as illustrated below:
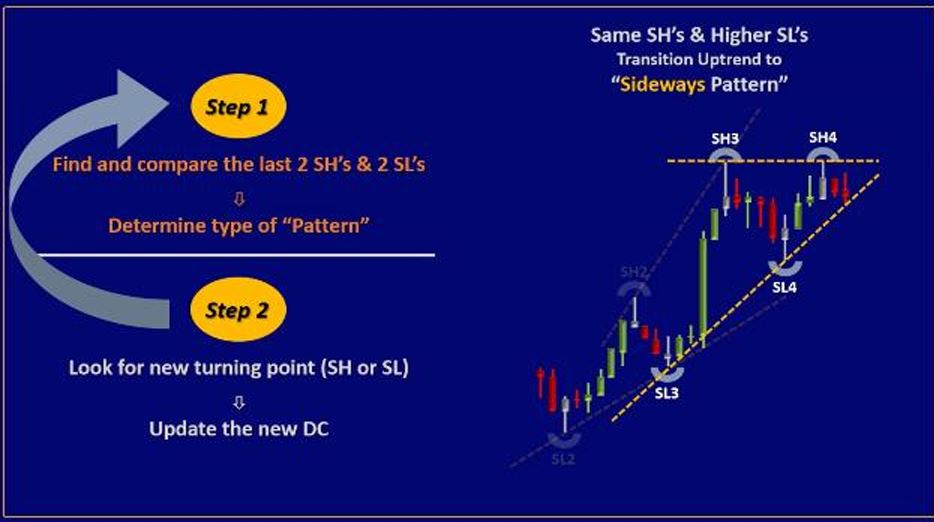
Following the price chart in the above example, we observe the formation of a new swing high and proceed to update the new dynamic channel accordingly (Step 2). By analyzing the type of the new pattern (Step 1), we observe that the dynamic channel shows the same swing high but a higher swing low. This indicates a transition from the previous uptrend pattern to a new sideways pattern. The updated chart illustration is provided below:
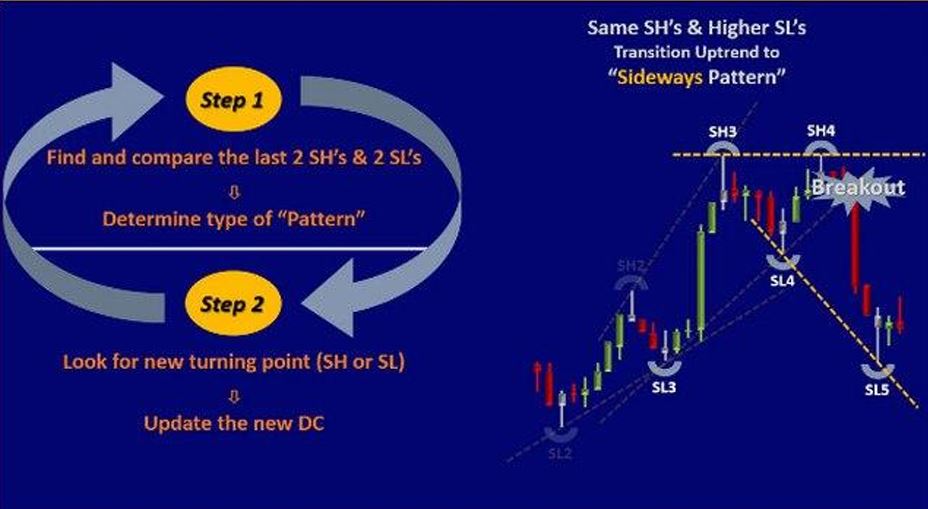
Following the price chart in the above example, we observe the formation of a new swing low and proceed to update the new dynamic channel (Step 2). By analyzing the type of the new pattern (Step 1), we observe that the dynamic channel shows the same swing high but a lower swing low has broken the previous dynamic support line. This indicates that the market is still in a sideways pattern, but with increased selling pressure, as illustrated below:
Following the price chart in the above example, we observe the formation of a new swing high and update the new dynamic channel accordingly (Step 2). By analyzing the type of the new pattern (Step 1), we observe that the dynamic channel shows a lower swing high and also a lower swing low. This indicates that the market has transitioned from the sideways to downtrend pattern, as illustrated below:
You have learned in this lesson, using an example of live market data in a forward test manner, how to update the dynamic channel with every new price turning point. You have also mastered the skill of analyzing the new pattern development and observed the conversion of an uptrend pattern to a sideways pattern, as well as the transition from one sideways pattern to another or to a new downtrend pattern. Now, let’s practice following this simple 2-step process and honing our skills in recognizing the interconversion of patterns in real market charts. It is important to allocate dedicated time for practice in order to develop and refine your skills in this area. Utilize various techniques such as forward-testing, market replay, and live demos to acquire the essential PAAT skills necessary for success in trading.