Dynamic Support & Dynamic Resistance
In this lesson of Module 1, workshop 3, we will discuss the concept of Support and Resistance.
As mentioned earlier, the human psychology of crowds, also known as the herd mentality, makes the market an emotional living entity.
s a result, many traders make decisions based on their emotional and cognitive mindsets, even if they have a trading plan in place.
The swing high and swing low levels are very important turning points from the perspectives of price psychology,
As the psychological shift between the greed and fear phases of the market occurs at these points.


Amateurs often miss to see the change in the market phase, and typically respond to turning points late,
Thus entering and exiting late, and getting trapped in losing positions.
Meanwhile, professionals typically buy during the right time from amateurs who are selling out of fear,
and sell to amateurs when they are buying late with greed.
This behavior gives swing high or swing low price areas its own psychological memory in trader’s minds, Due to a trader’s past lost and missed opportunities at these points.
Therefore, when the price comes back to these areas that have emotional footprints of past profits and losses, all major market participants have a common tendency to react to them. This is the foundation and basis of the concept of Support and Resistance.

The Support and Resistance are important elements of advanced price action, market structure, high probability trading areas and setups, which will be discussed in detail in subsequent modules.

Support Area:
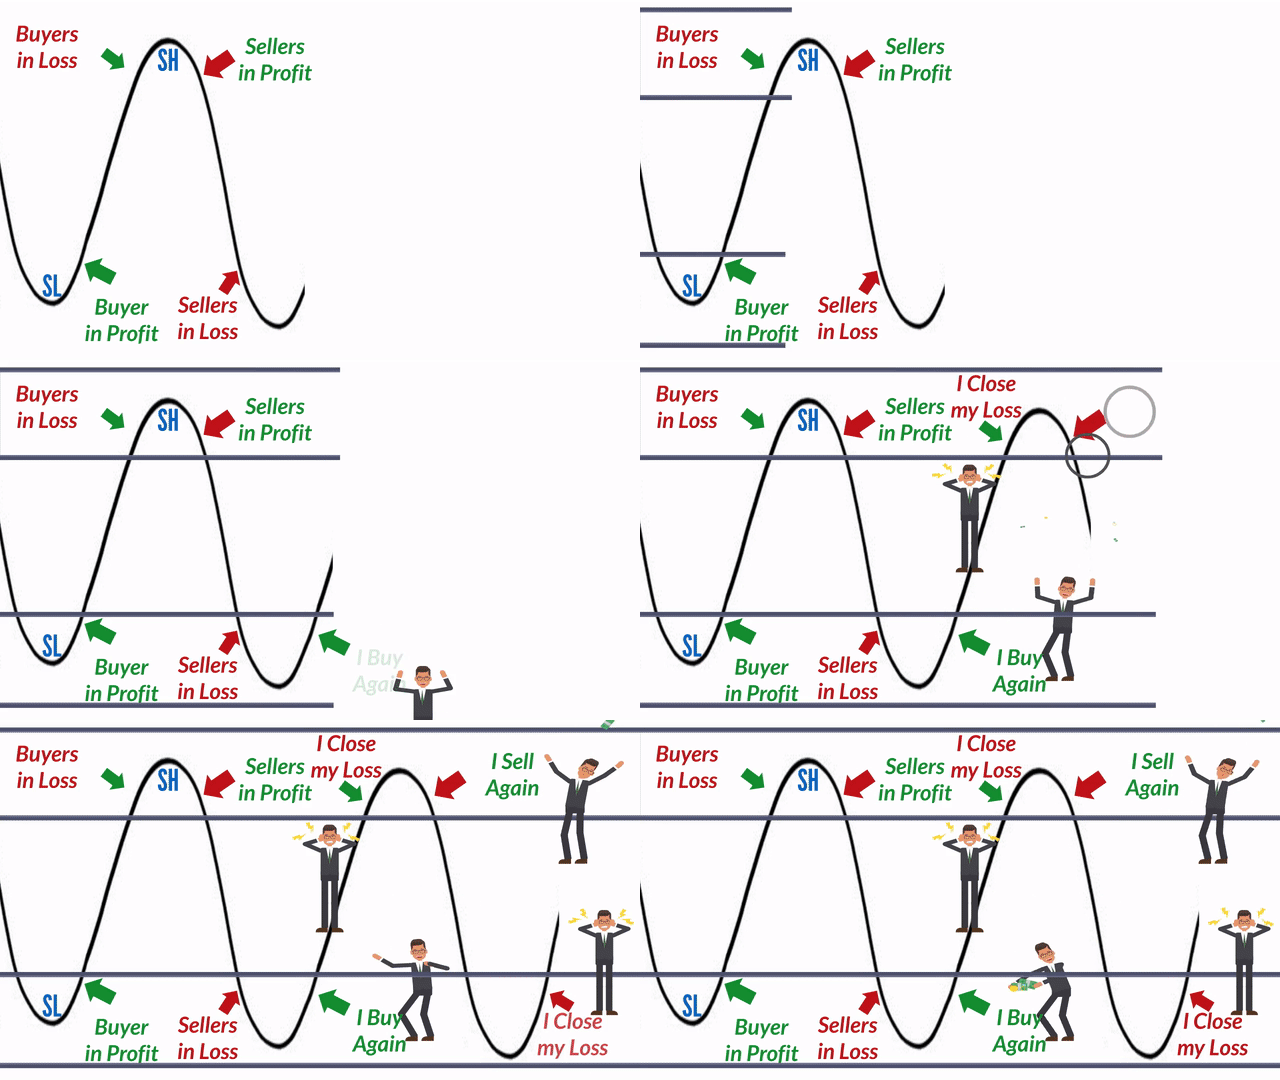
A support area is formed when the price reaches close to the previous swing low areas, where it faces serious buying pressure from the majority of market participants.


To understand the concept of Support area, and the reason behind its formation, let’s follow the decision making processes of 4 major market participants, when the price gets close to the previous Swing Low areas.
The professional buyers, who have been waiting for the price to fall close to the Swing Low area, see this opportunity to buy at a low price, adding significantly to the buying pressure.


The professional sellers, who entered the downward move early, start closing their profitable positions near the Swing Low area. By sending buy to cover orders to close their positions, professional sellers add to the buying pressure.
The amateur sellers, who entered the downward price direction near the previous Swing Low area, have been waiting for the price to fall down and exit their losing positions at minimum loss. The buy to cover closing orders of these novice traders near the swing low adds to the buying pressure.


The amateur buyers, who have been waiting to get rid of their losing positions, or get more confirmation to enter, would wait for the upward move, and do not sell close to the swing low. And would add to buying orders later.
As you see, all major market participants made trading decisions that lead to increase in buy orders when the price reached past swing low areas. The buying pressure holds the price from falling further, and supports the price at that level. This is the reason for the formation of the Support area near the previous swing lows, which is often strong to reverse the price up.

Dynamic Support (DS):
As mentioned earlier, the support is formed near the previous swing low areas, due to buying pressures from all the major market participants.


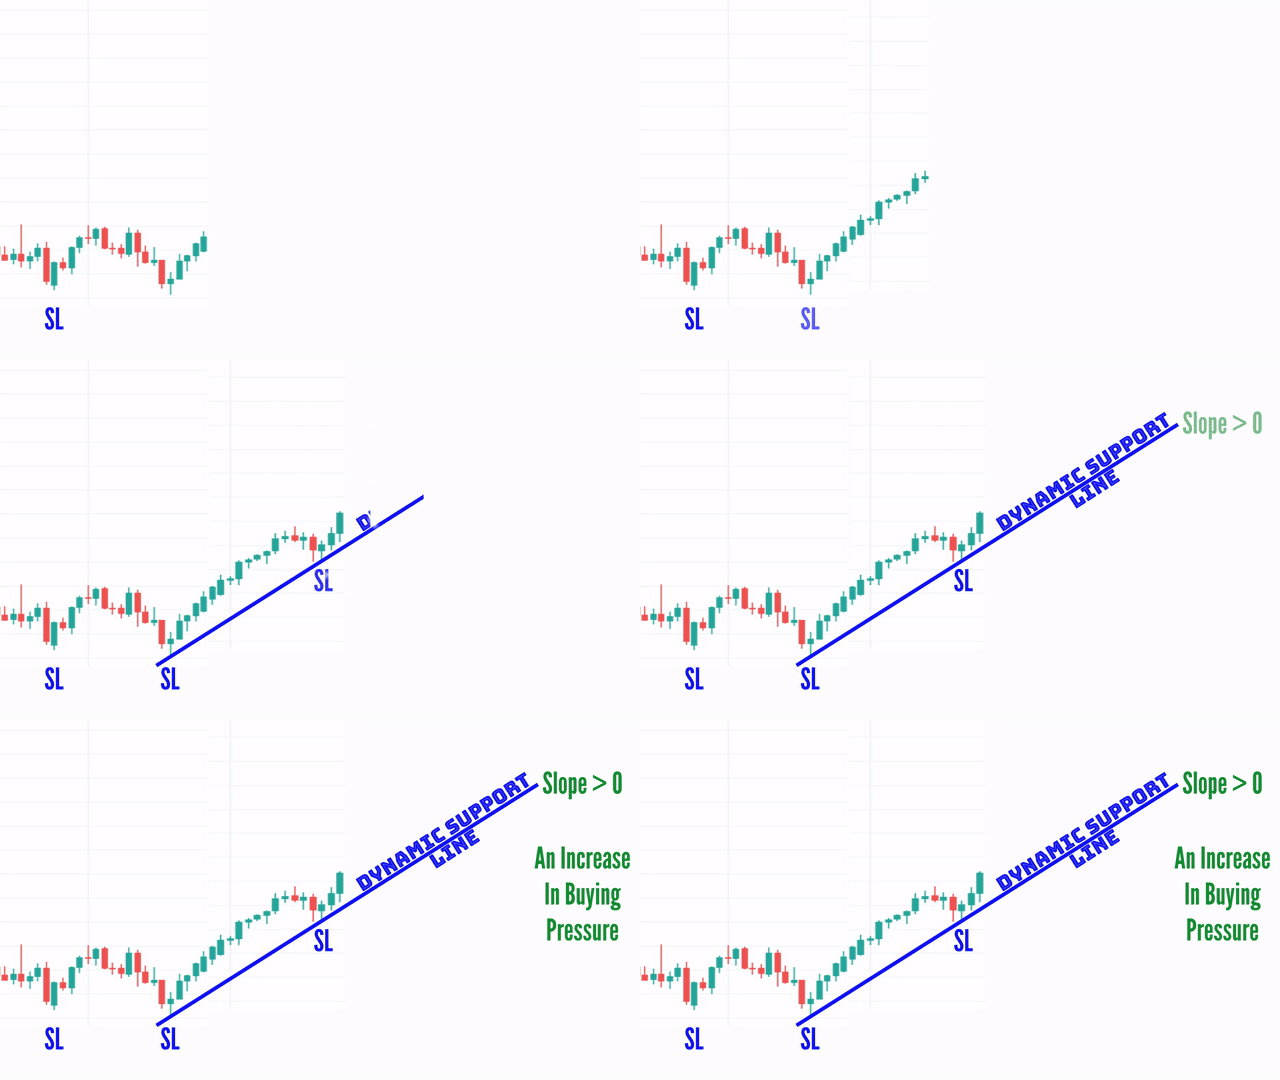
To provide a visual representation of the support area on the price chart, one can connect the troughs of the last two Swing Low points, creating a Dynamic Support (DS) Line.
When the swing lows are aligned horizontally, the dynamic support line has a slope of zero, indicating there is no change in buying pressures from market participants.


When the Swing lows are aligned in an upward fashion, the slope of the dynamic support line is positive, suggesting an increased buying pressure from market participants.
When the Swing lows are aligned in a downward pattern, the slope of the dynamic support line is negative, indicating decreased buying pressure from market participants.

Resistance Area:
A Resistance area is formed when the price reaches close to the previous swing high areas, where it faces serious selling pressure from the majority of market participants.


To understand the concept of Resistance area, and the reason behind its formation,
let’s follow the decision making processes of 4 major market participants, when the price gets close to the previous Swing High areas.
The professional Buyers, who entered the upward price movement early, start closing their profitable positions near the Swing High area. By sending sell orders to close their positions, professional buyers add to the selling pressure.

The professional sellers, who have been waiting for the price to rise close to the Swing High area, see this opportunity to sell at a high price, adding significantly to the selling pressure.
The amateur sellers, who entered the downward price movement near the previous Swing Low area, are anxious to see the price fall and exit their losing positions at a minimum loss. These amateur sellers would not buy near the Swing High area, and wait to get rid of their losing positions or add to sell orders later on.


The amateur buyers, who entered the upward price movement late, have been waiting for the price to come back near the Swing High areas again. The sell orders of these novice traders to close their losing positions near the previous Swing High adds to the selling pressure.
As you can see, all the major market participants made trading decisions that lead to an increase in sell orders when the market price reached previous Swing High areas. The selling pressure holds the price from rising further and acts as a Resistance area near the previous swing highs, which is often strong enough to reverse the price back down again.

Dynamic Resistance
As mentioned earlier, the Resistance is formed near the previous swing High areas, due to Selling pressures from all the major market participants.


To provide a visual representation of the Resistance area on the price chart, one can connect the Peaks of the last two Swing High points, creating a Dynamic Resistance Line.
When the swing Highs are aligned horizontally, the dynamic support line has a slope of zero, indicating there is no change in Selling pressures from market participants.


When the Swing Highs are aligned in a downward pattern, the slope of the dynamic Resistance line is negative, indicating increased Selling pressure from market participants.
When the Swing Highs are aligned in an upward fashion, the slope of the dynamic Resistance line is positive, suggesting decreased Selling pressure from market participants.

