What Is Range Trading?
In this lesson of Module 1, workshop 2, We will discuss the concept and definition of Range in detail.
As mentioned earlier, each single swing price is made of one swing high and one swing low turning point.
The price moves in a wave shape pattern constantly between these opposite swings high and swing low turning points, which creates various market structures and patterns.
We can measure how far the price has moved between these turning points, which lead us to the concept of Range.


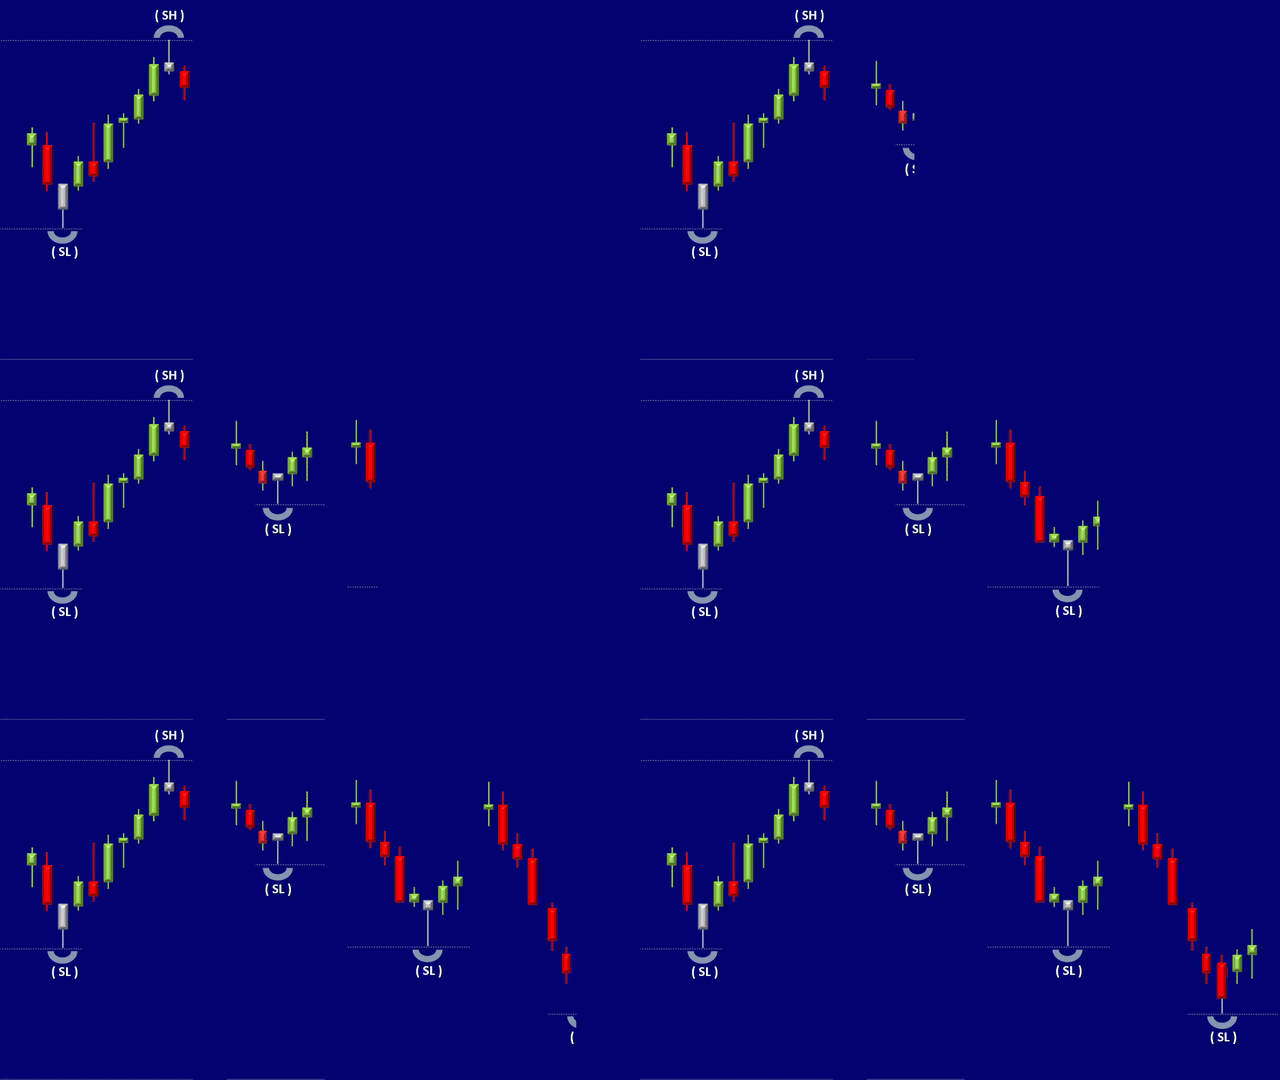
We define Range as the distance a price has traveled between the nearest Swing Low and Swing High.
This will be vice versa in a downward price movement between a Swing High and Swing Low.
Range provides important information to quantify the buying and selling pressure of market participants.


An increase in the number of buyers in the market causes the price to move upwards. The price moves longer distance and creates a wider range, adding to the upward momentum.
When more sellers enter the market as the price moves downwards, the price moves longer distance and creates a wider range, accelerating the downward momentum.
Therefore, the Range is an important part of advanced price action, market structure, momentum analysis, and one of our Algo entry conditions, which will be discussed in details in subsequent modules.

Drawing Range Line:
As mentioned earlier, the Range is the distance price has traveled between the nearest Swing High and Swing Low. And vice versa in a downward price movement.


To make this definition practical and visual for comparative analysis, we can draw a Range Line on each swing wave of a price chart.
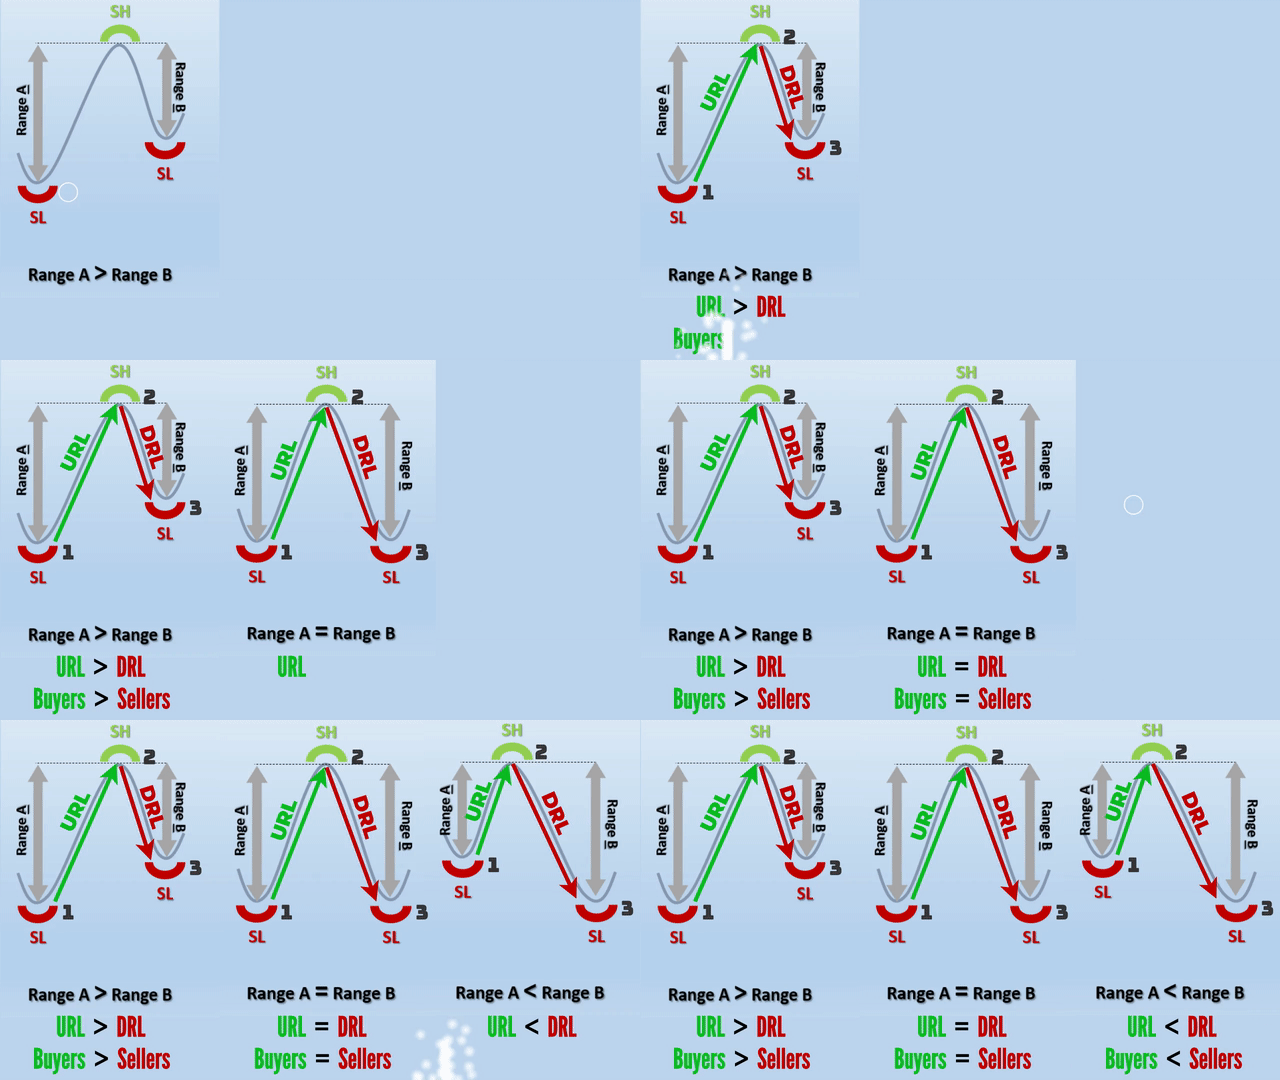
In an upward price movement, we can draw an Upward Range Line, abbreviated as URL, by connecting the Trough of the Swing Low to the peak of the Swing High.
In a downward price movement, we can draw a Downward Range Line, abbreviated as DRL, by connecting the Peak of the Swing High to the Trough of the Swing Low.

Comparing URL and DRL:
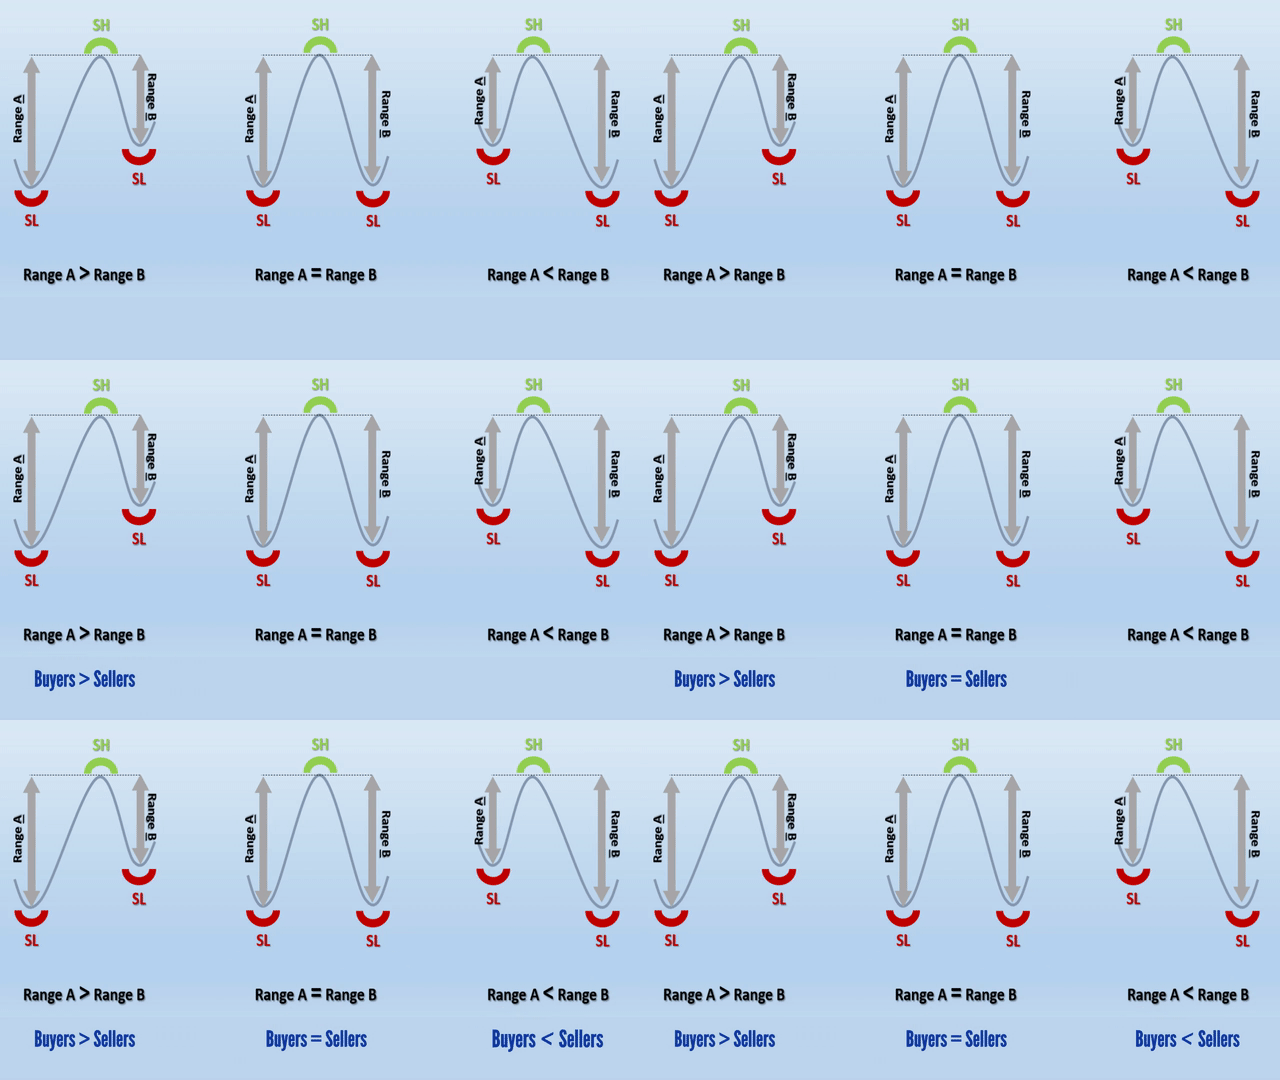
A price action analyst can use three consecutive turning points, and compare two ranges, to gain significant insight into the buying and selling pressure of the major market participants.


If the URL is greater than DRL, there are more buyers than sellers in the market.
If the URL is the same as the DRL, then the number of buyers equal the number of sellers in the market.
If the URL is less than the DRL, then the number of sellers in the market is greater than the number of buyers in the market.
Therefore, it is important to monitor the price behavior following any turning point to see how the next phase of the swing is evolving in the opposite direction.

