Trending Patterns and Relationship Between Pattern and Range
In this lesson of Module 2, Workshop 5, we will discuss the concept of Patterns.
You have seen variations of the dynamic channels on the price chart With different directions and ranges, which formes various Patterns on the price chart.
We can simplify and categorize all these patterns into 2 main categories based on their directions

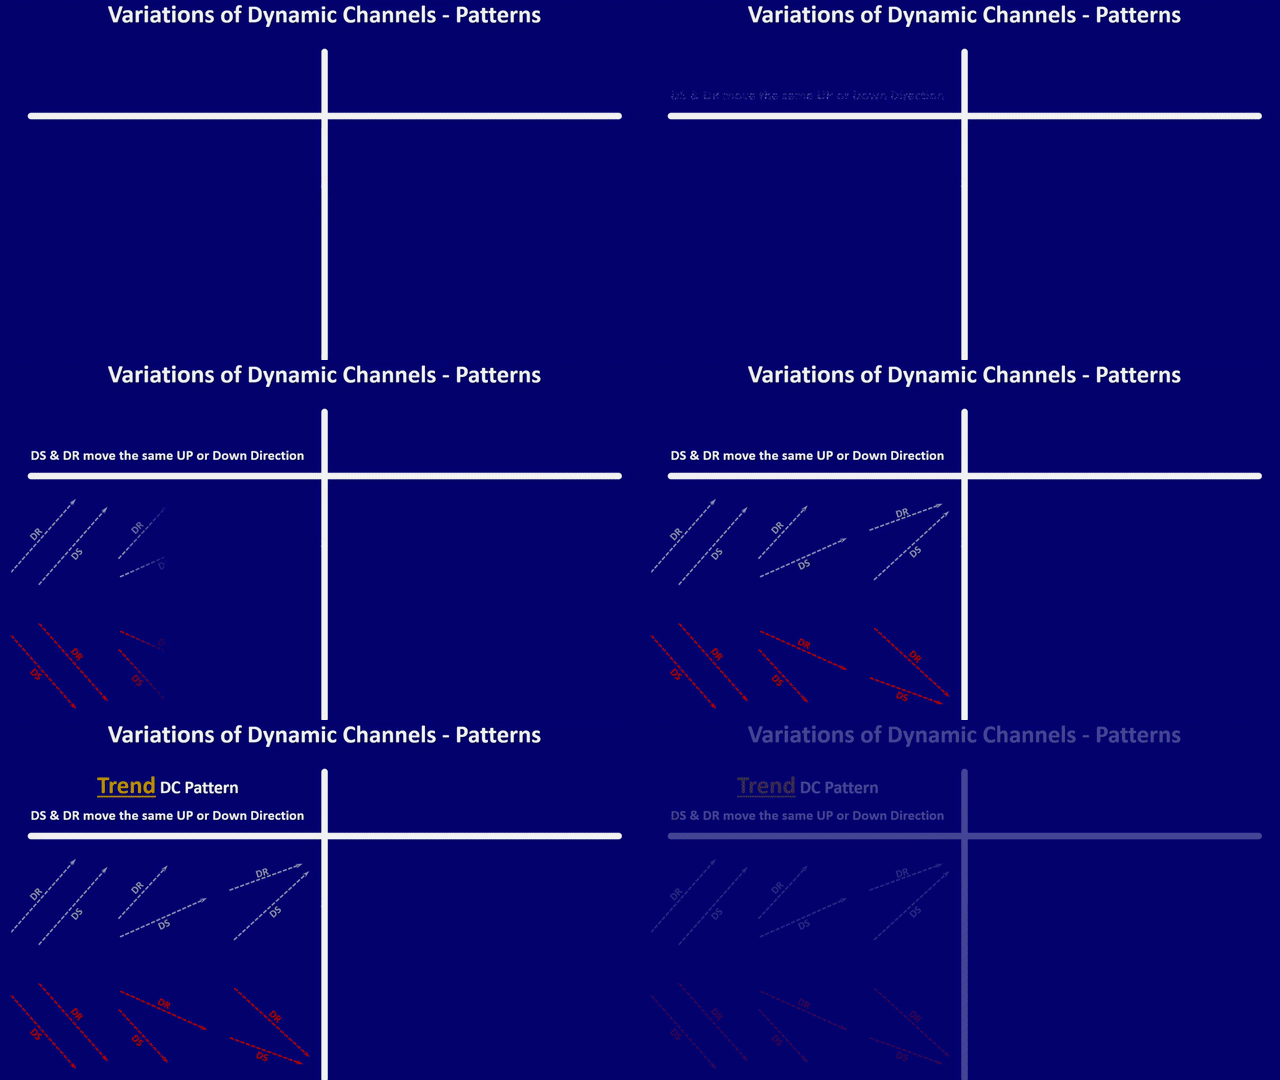
When Dynamic support and Resistance move in the same direction, we categorize them under Trend patterns.
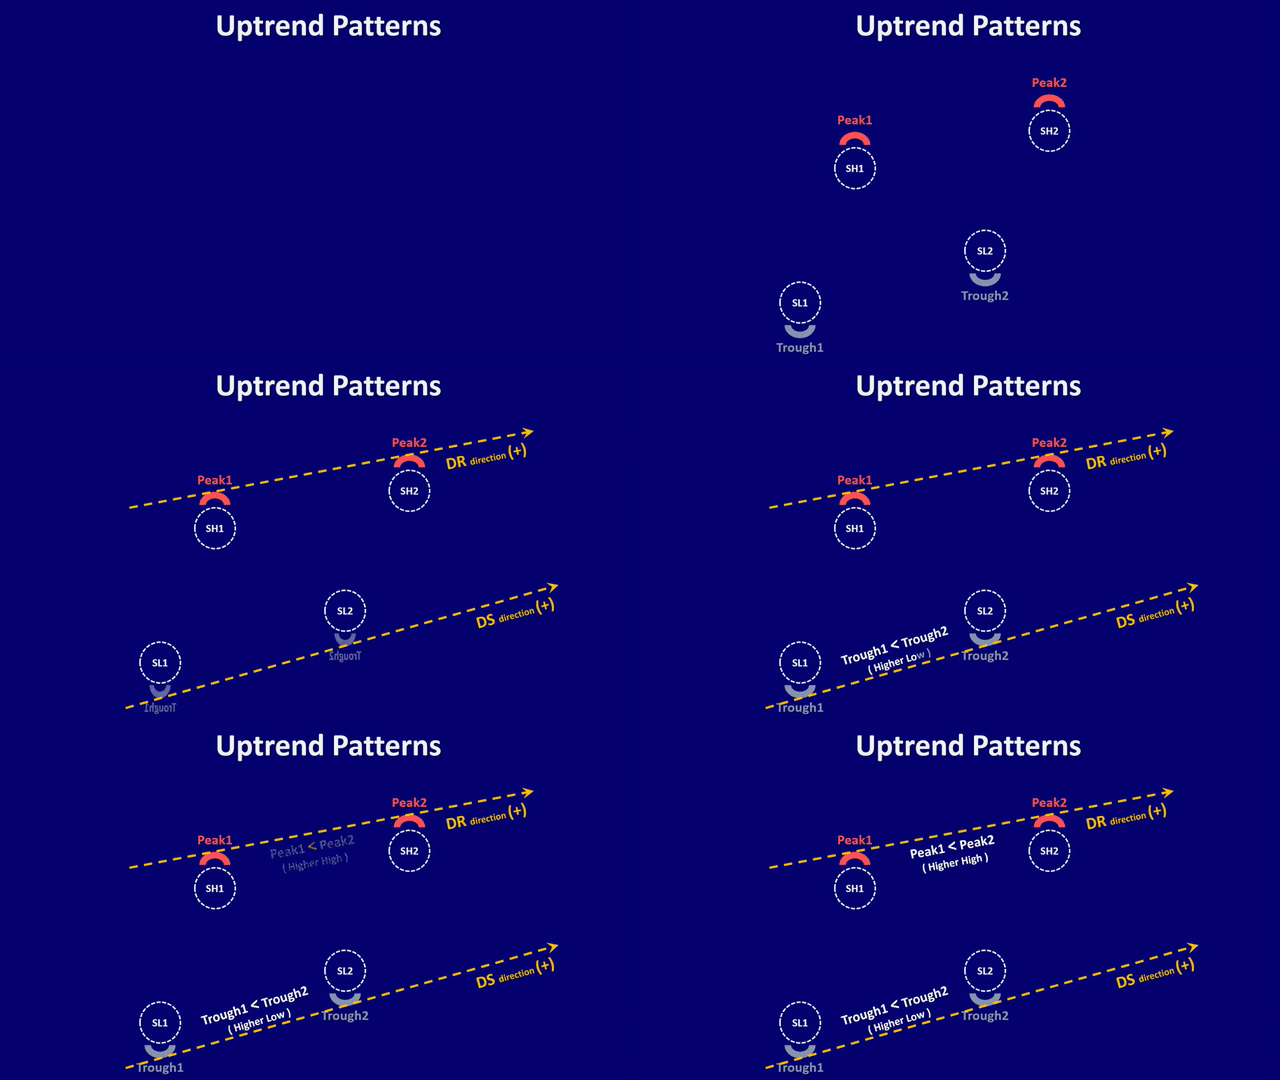
When Dynamic support and Resistance move in the upward direction, we call them the Uptrend patterns.
In the uptrend pattern, you will see higher lows on the dynamic support line, And higher high on the dynamic resistance line.
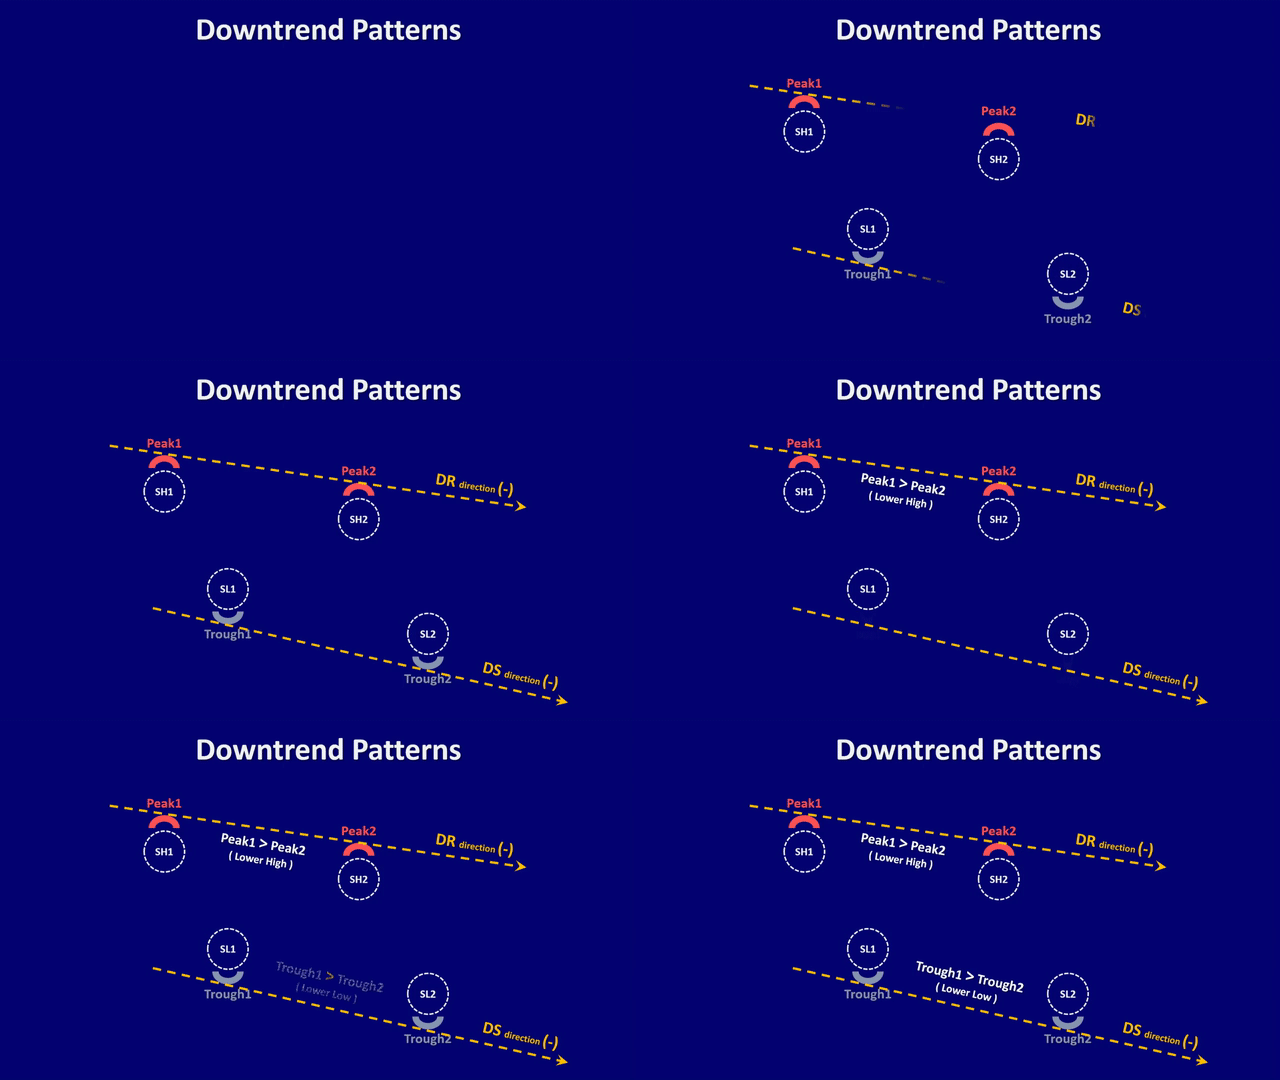
When Dynamic support and Resistance move in the downward direction, we call them the DownTrend patterns.
In the DownTrend pattern, you will see lower high on the dynamic resistance line, And lower low on the dynamic support line!
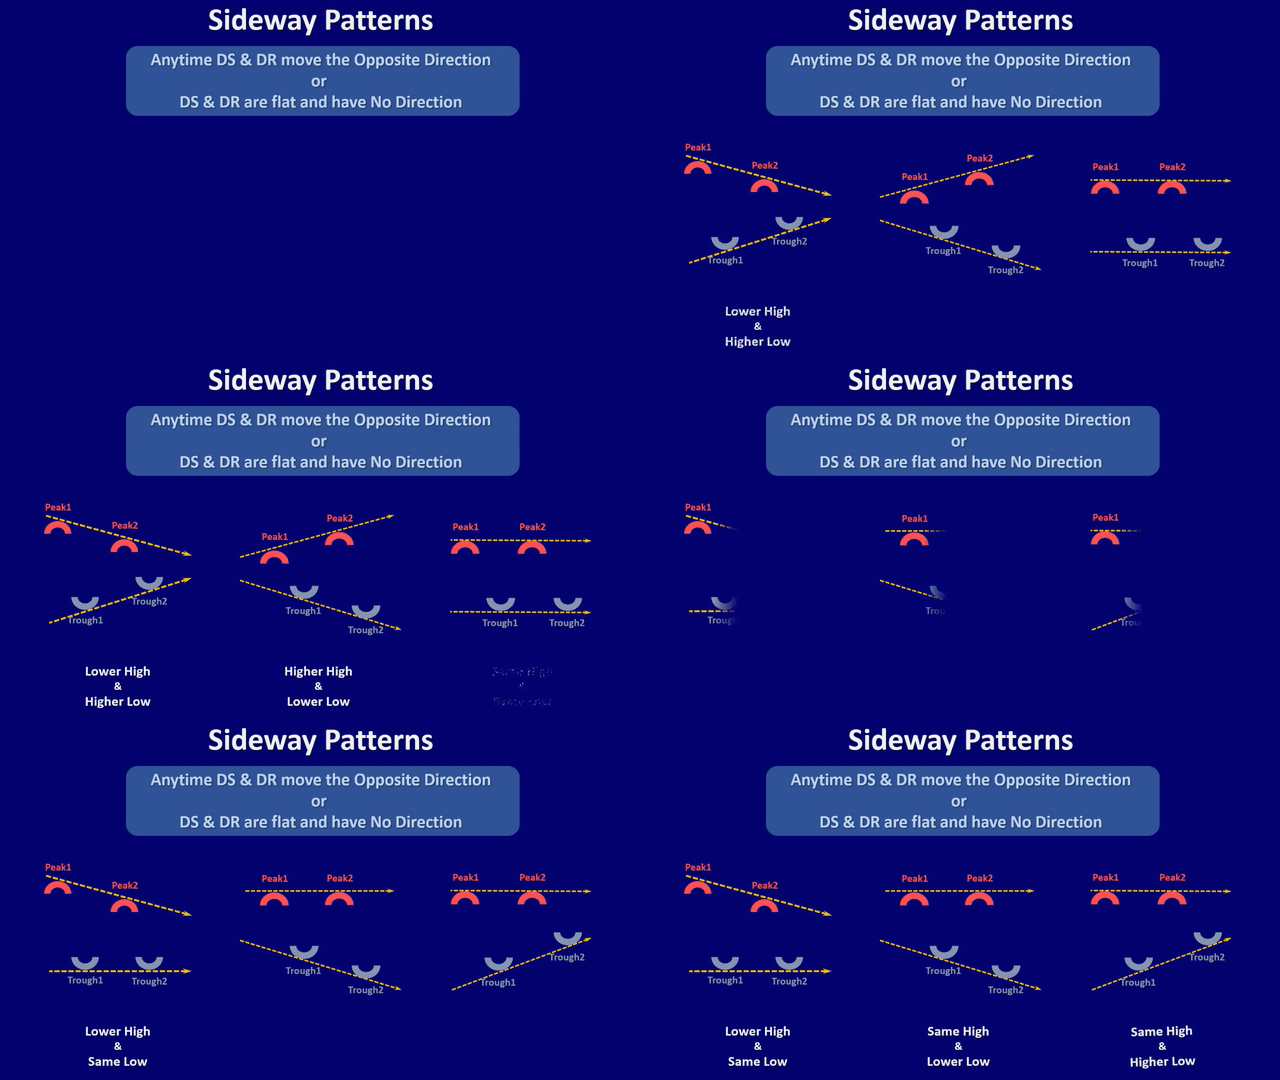
When Dynamic support and Resistance move in the opposite direction or have no direction, we categorize them under the Sideway pattern.
That is anytime you see that the dynamic support or resistance move in the Opposite Directions or are flat and have No Directions
In this lesson of Module 2, Workshop 6, we will discuss the Relationship between Pattern and Range.
You have learned that a pattern that you see in each dynamic channel is made up of four turning points, two swing lows that form the dynamic support line and two swing highs that form the dynamic resistance line.
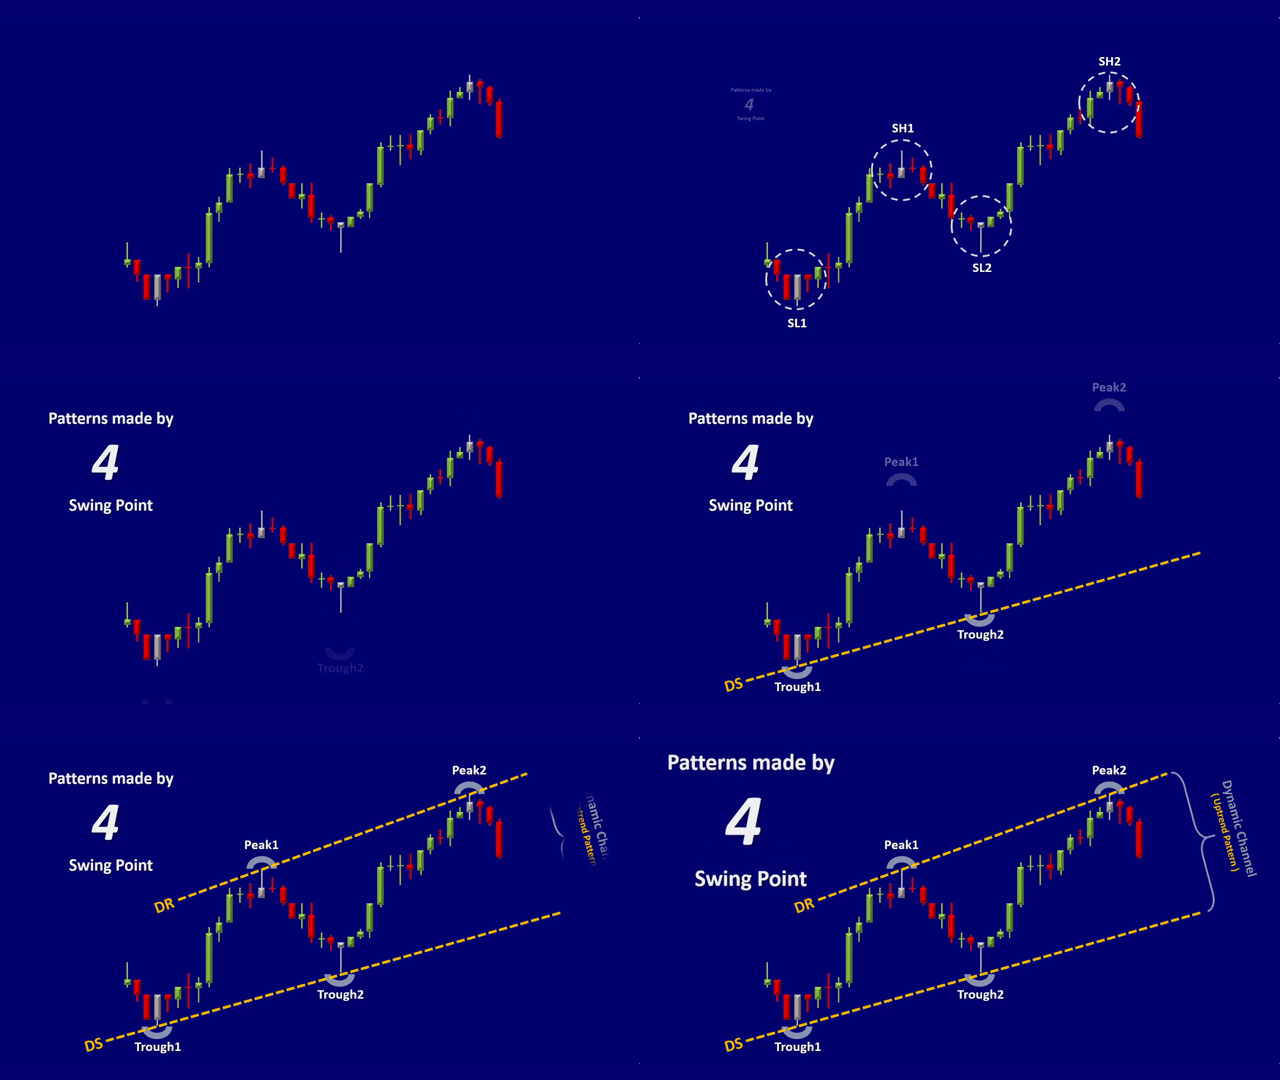

You should be able to identify three consecutive range lines within each pattern of the dynamic channel.
Comparing the size of range lines will provide useful information about the changes in buying versus selling pressure , which will be discussed in the momentum analysis module later.

